
CS-03 · Power BI · Production operations
Daily Production & Downtime Dashboard
Production fell short of plan. Where should the review begin?
Start with the gap between planned and good output. Narrow the scope, then examine downtime records and work orders that need a human follow-up.
Portfolio demo | Synthetic data | Not client results
Démonstration de portfolio | Données synthétiques | Aucun résultat client
Explore the two viewsBusiness question
Separate the production gap from its possible explanations.
A plan-versus-output comparison tells a production team where to look. Event records and work-order dates add context, but do not by themselves explain why a shortfall occurred.
A two-step review
- Compare eligible plan with good output across products, scheduled months and lines.
- Inspect planned/unplanned downtime records, recorded reasons and orders requiring review.
This demonstration organizes an investigation; it does not replace a scheduling system or a conversation with the plant team.
Actual Desktop captures
One question for each page.
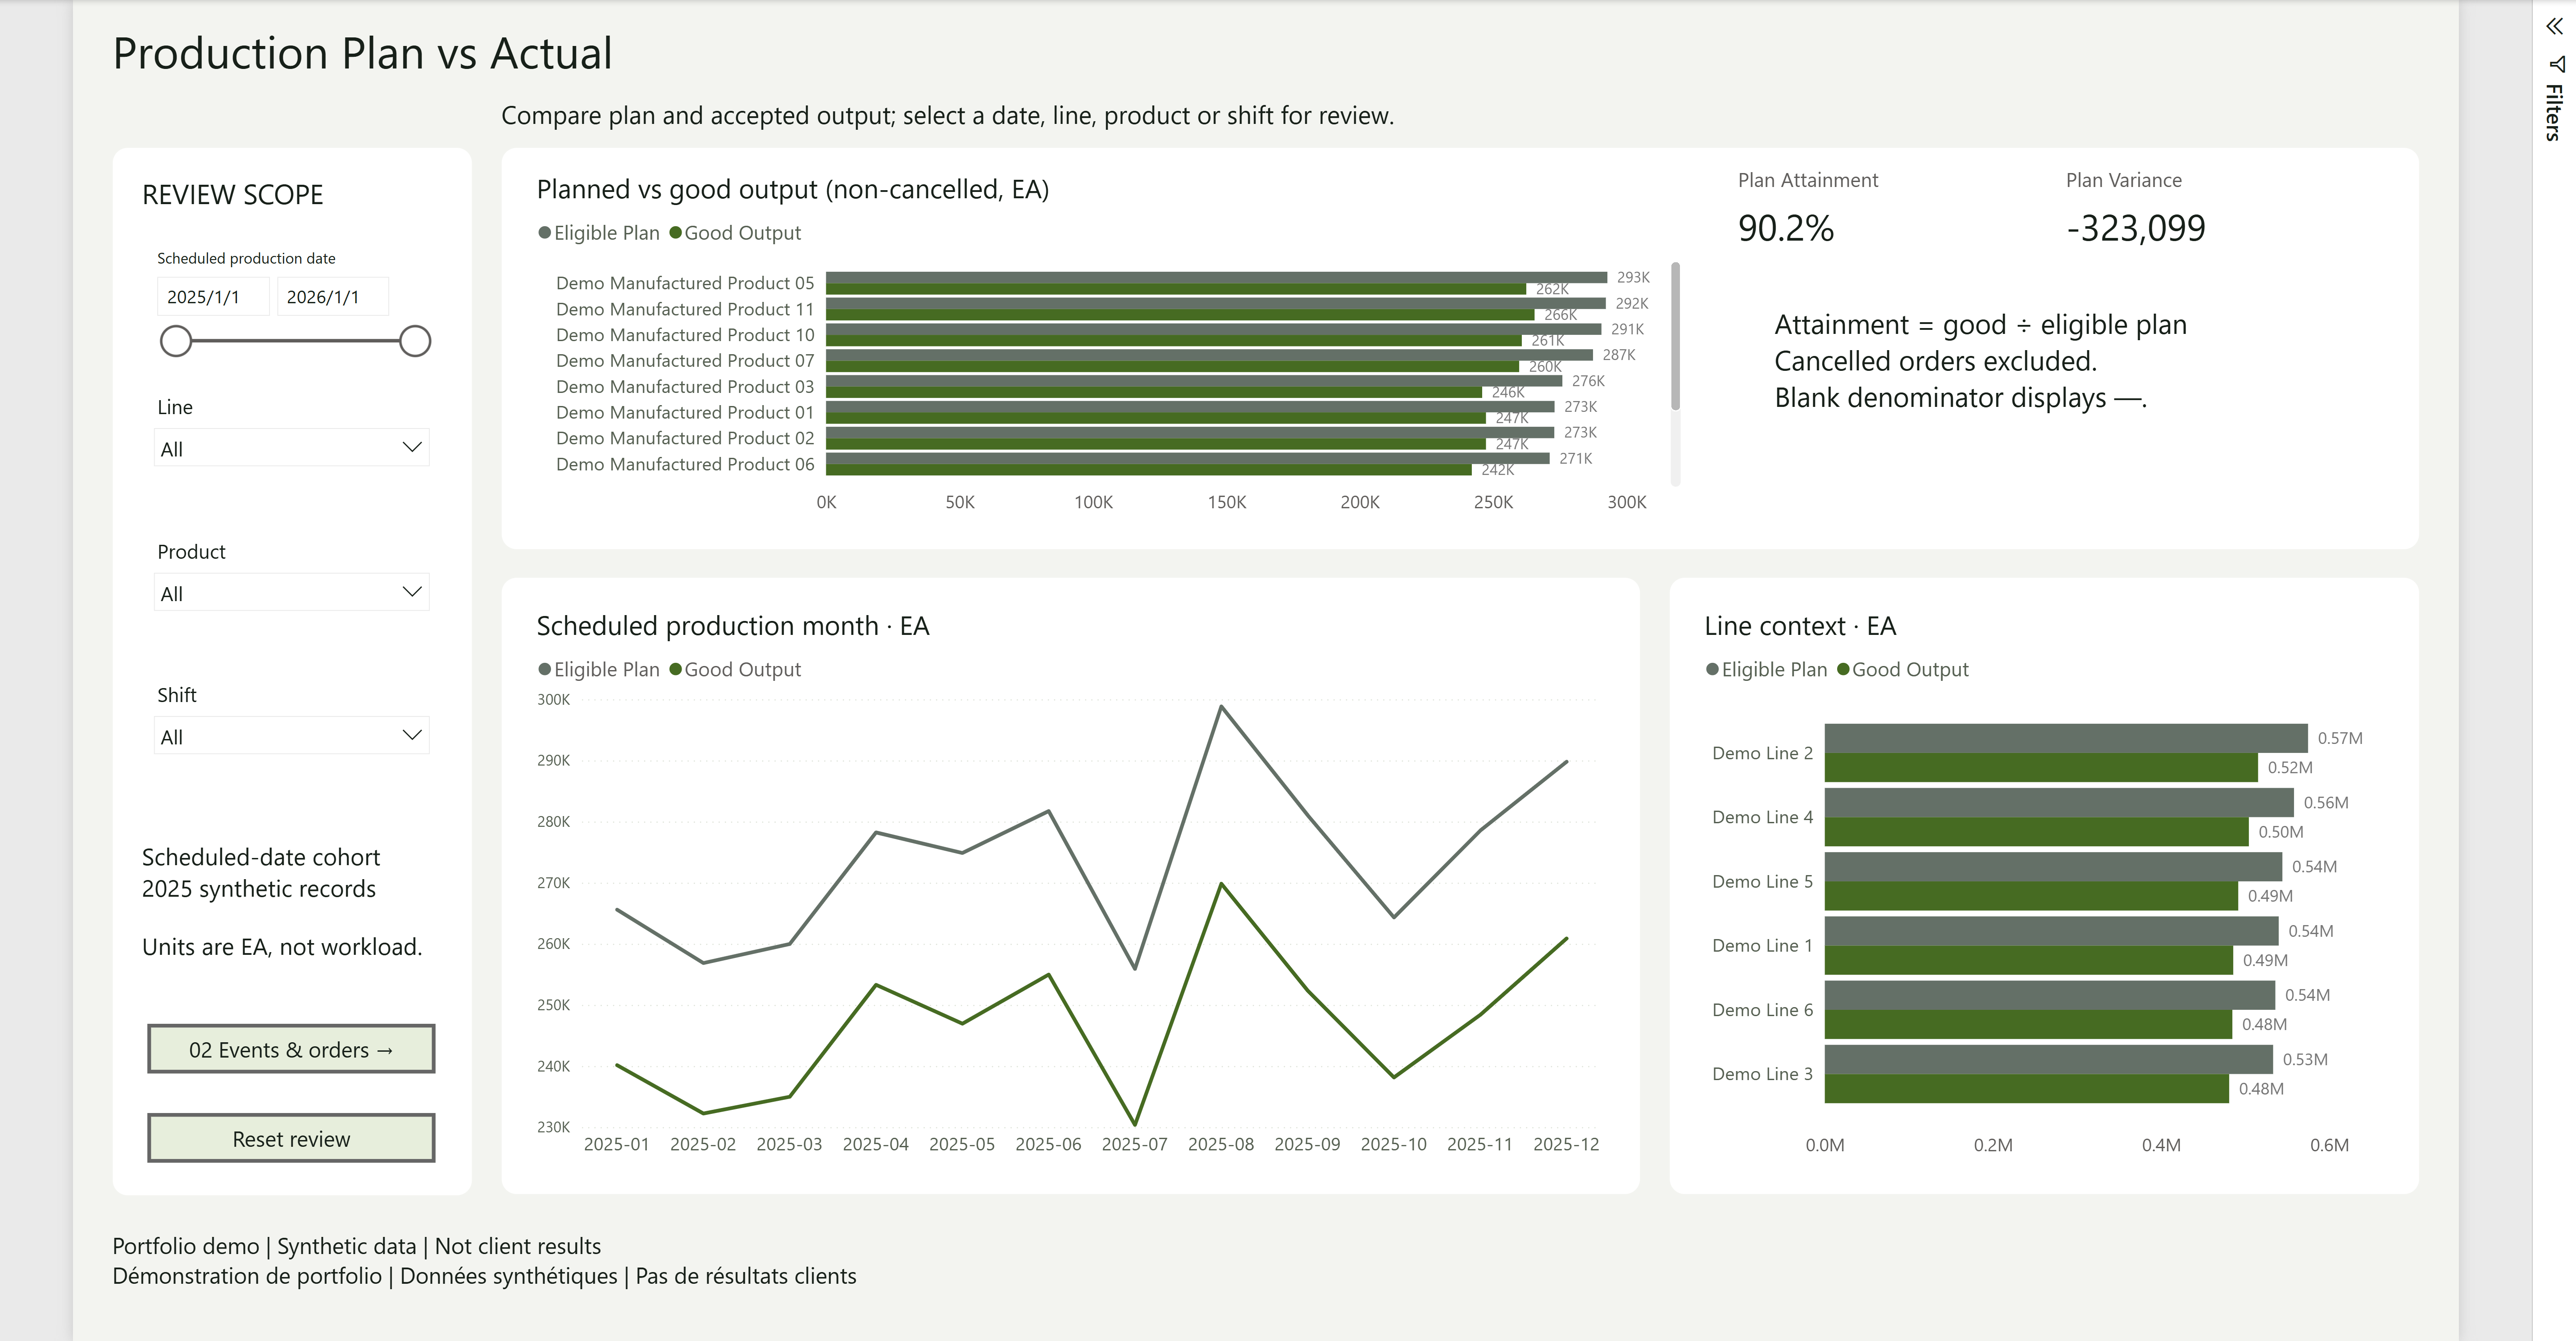
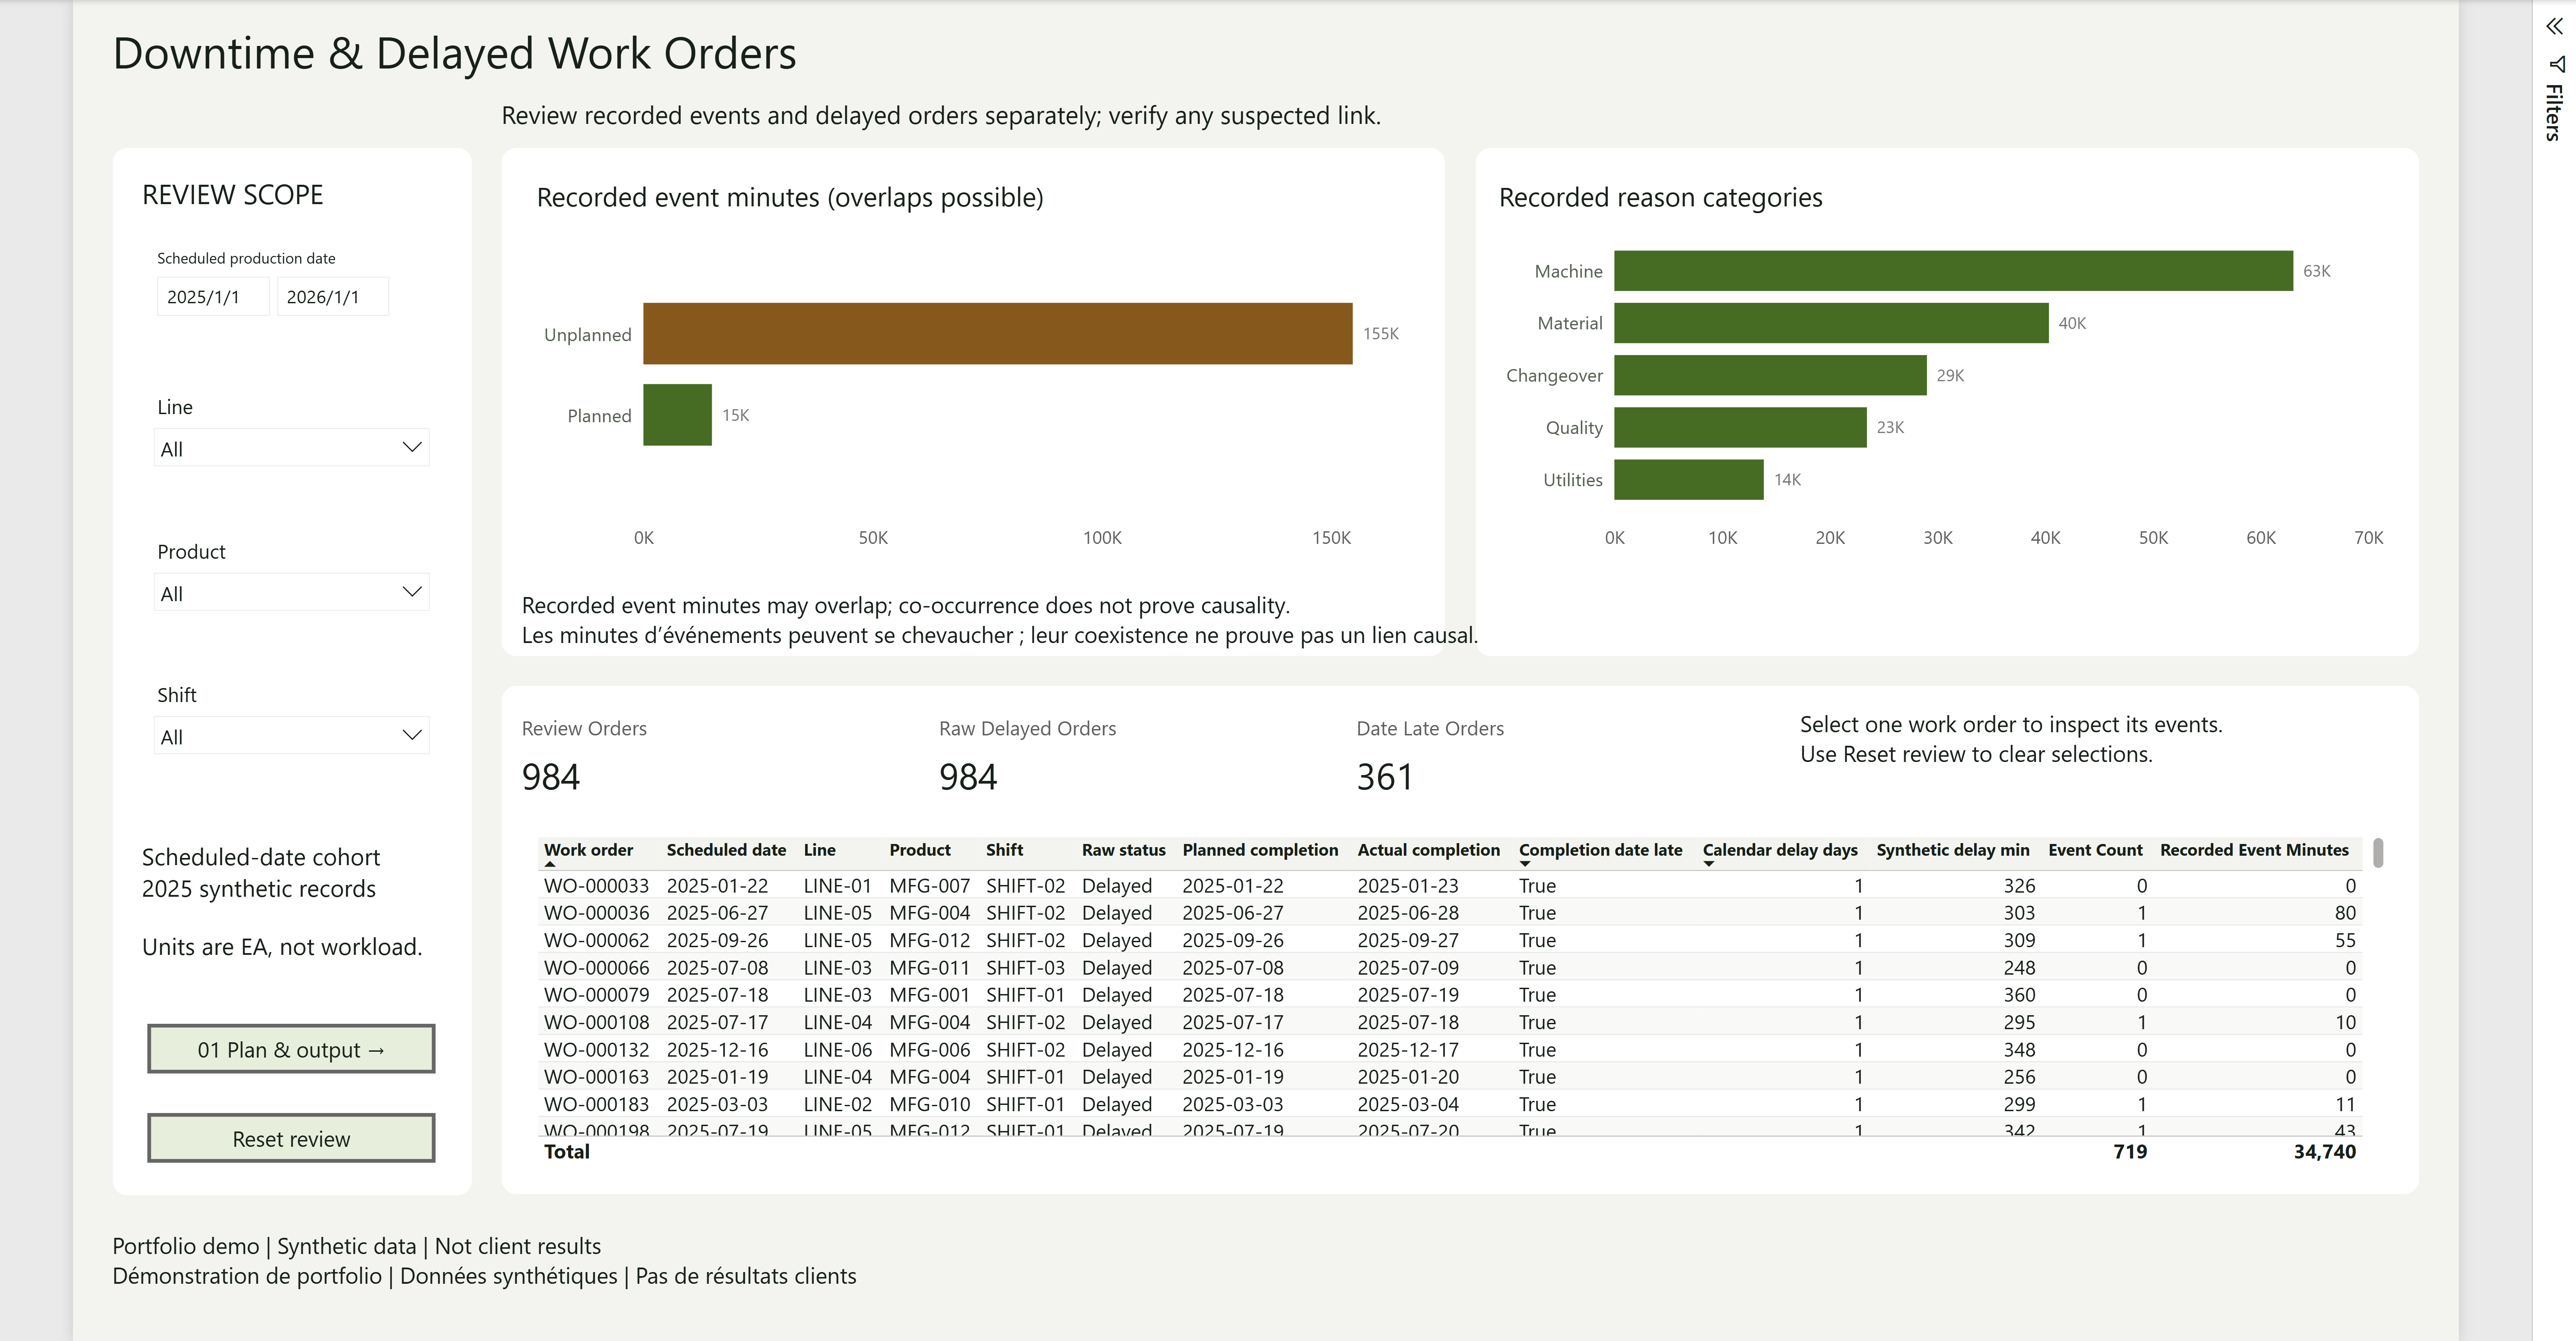
Both captures come from the same saved native report version. Default scope: all dates, lines, products and shifts, with no row or chart selection. The date control spans 1 January 2025–1 January 2026; the scheduled production cohort and monthly timeline are 2025. These are static screenshots, not an embedded interactive report.
Production Plan vs Actual
For: Plant managers, production managers and line supervisors
Question: Where does good output fall short of the eligible plan?
Comparer le plan et la production conforme sur le même périmètre de dates planifiées, puis examiner les produits, les mois et les lignes. Les ordres annulés sont exclus du taux de réalisation.
Possible follow-up: Choose a date, line, product or shift for investigation. Quantities are EA, not standardized workload; different product mixes can require different effort.
Downtime & Delayed Work Orders
For: Production managers, maintenance leads and continuous-improvement teams
Question: Which records should the team verify before deciding what to do?
Distinguer les événements planifiés et non planifiés, puis examiner les dates et le statut des ordres. Le tableau de revue est un sous-ensemble des événements.
Possible follow-up: Check an order’s dates, status and associated event records with the relevant colleagues. A zero-event order can still need review. Co-occurrence does not establish a cause.
Read the definitions
The same records can answer different questions.
- Plan attainment: 90.2%
- 2,962,377 good units ÷ 3,285,476 eligible planned units = 90.1658%, rounded for display. Cancelled orders are excluded. The difference is −323,099 EA; this is a sample-data comparison, not an improvement result.
- 984 raw delayed vs 361 date-late orders
- Raw Delayed is the source status. Date-late compares actual and planned completion dates under the audited rules. They are distinct definitions, not interchangeable counts. The review queue contains 984 orders in the default scope.
- 169,712 recorded event minutes
- 14,949 planned + 154,763 unplanned minutes across 3,579 events. Events may overlap; this sum is not deduplicated physical line-loss time. Recorded reason labels are not proven root causes.
- The review table is a subset
- Its default totals are 719 associated events and 34,740 recorded minutes, not all 3,579 events. Event categories do not redefine the production-plan denominator or imply that every delayed order has an event.
What this example can support.
HYDRADATA created the fictional production sample: six lines, three shifts, twelve products, 5,000 work orders and 3,579 event records. The scenario uses local plant time UTC+08:00. It is not a dataset from an operating factory.
Compare records, identify a review scope and ask better follow-up questions. Do not infer lost revenue, labor productivity or responsibility from these charts.
Limits and acceptance boundaries
- No OEE, MES deployment, real-time control, scheduling engine or predictive-maintenance claim.
- No client outcomes, ROI, cost savings or verified production improvement.
- Product and order lists scroll in Desktop; these still images show only the visible portion. Some long dropdown labels can truncate.
- Windows evidence records model refresh, DAX comparisons and selected interaction checks; the owner accepted the final visuals. External PBIR schema validation remains partial because one visual schema was unavailable. This is not a claim of exhaustive validation.
Behind the design
From a visual reference to a production review.
The earlier design article shows unbound templates. The two images above are the subsequent native Power BI captures; the article is not a substitute for report evidence.
Read the design processNeed a clearer production review?
Start with your planning records, output definitions and the questions your team needs to investigate.